| Map of areas and locations for geological emissions of methane |
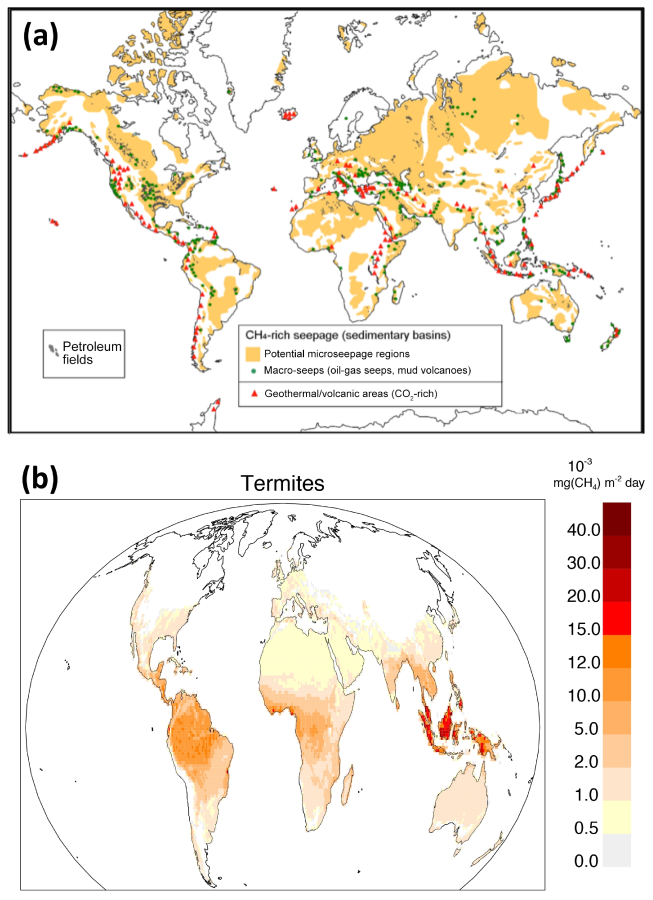
Figure 4. (a) Map of areas and locations for geological emissions of methane related to the different categories mentioned in the text (Sect. 3.2.3). (b) Climatological CH4 emissions from termites over the period 2000–2007 (Sect. 3.2.4). |
|
| Source: Earth System Science Data |
URL: http://www.earth-syst-sci-data.net/8/697/2016/essd-8-697-2016.pdf
(The text for the image(s) on this Web page was taken from the above source.) |