| Upper Ocean Temperatures Hit Record High in 2020 |
| Regional observed upper 2000 m ocean heat content change from 1955 through 2020 |
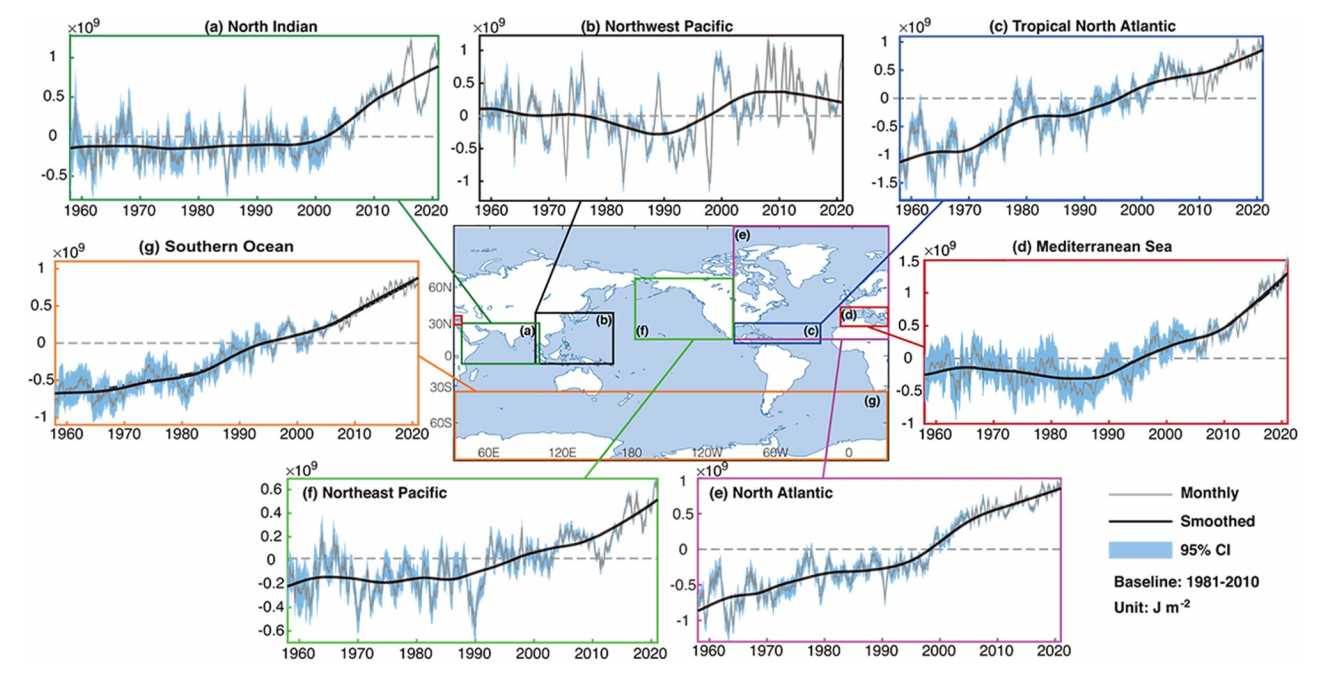
Fig. 4. Regional observed upper 2000 m OHC change from 1955 through 2020 relative to 1981-2010 baseline. The time series (black) are smoothed by LOWESS (locally weighted scatterplot smoothing) with span width of 24 months. The blue shadings are the 95% confidence interval. [Data updated from Cheng et al. (2017)]. |
|
| URL: https://link.springer.com/article/10.1007/s00376-021-0447-x |