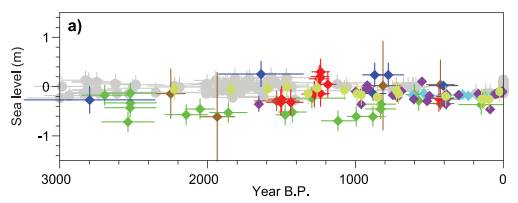
Paleo sea level data for the last 3000 years from Northern and Southern Hemisphere sites. The effects of glacial isostatic adjustment (GIA) have been removed
from these records. Light green = Iceland (Gehrels et al., 2006), purple = Nova Scotia (Gehrels et al., 2005), bright blue = Connecticut (Donnelly et al., 2004), blue = Nova Scotia
(Gehrels et al., 2005), red = United Kingdom (Gehrels et al., 2011), green = North Carolina (Kemp et al., 2011), brown = New Zealand (Gehrels et al., 2008), grey = mid-Pacific
Ocean (Woodroffe et al., 2012). | Since the AR4, there has been significant progress in resolving the sea level history of the last 7000 years. RSL records indicate that from ~7 to 3 ka, GMSL likely rose 2 to 3 m to near present-day levels (Chapter 5). Based on local sea level records spanning the last 2000 years, there is medium confidence that fluctuations in GMSL during this interval have not exceeded ~ ±0.25 m on time scales of a few hundred years (Section 5.6.3, Figure 13.3a). The most robust signal captured in salt marsh records from both Northern and Southern Hemispheres supports the AR4 conclusion for a transition from relatively low rates of change during the late Holocene (order tenths of mm yr–1) to modern rates (order mm yr–1) (Section 5.6.3, Figure 13.3b). However, there is variability in the magnitude and the timing (1840–1920) of this increase in both paleo and instrumental (tide gauge) records (Section 3.7). By combining paleo sea level records with tide gauge records at the same localities, Gehrels and Woodworth (2013) concluded that sea level began to rise above the late Holocene background rate between 1905 and 1945, consistent with the conclusions by Lambeck et al. (2004) |