EIA
This Fact Page displays text and images related to global warming and climate change
(Hover your mouse over the text below to "popup" a window with a related text.
Click on the text or image to open a new window with a detailed description.)
|
|
| | | | | | | U.S. greenhouse gas emissions are grouped according to where they were produced (or burned - Figure A) and according to where they were consumed (or used – Figure B).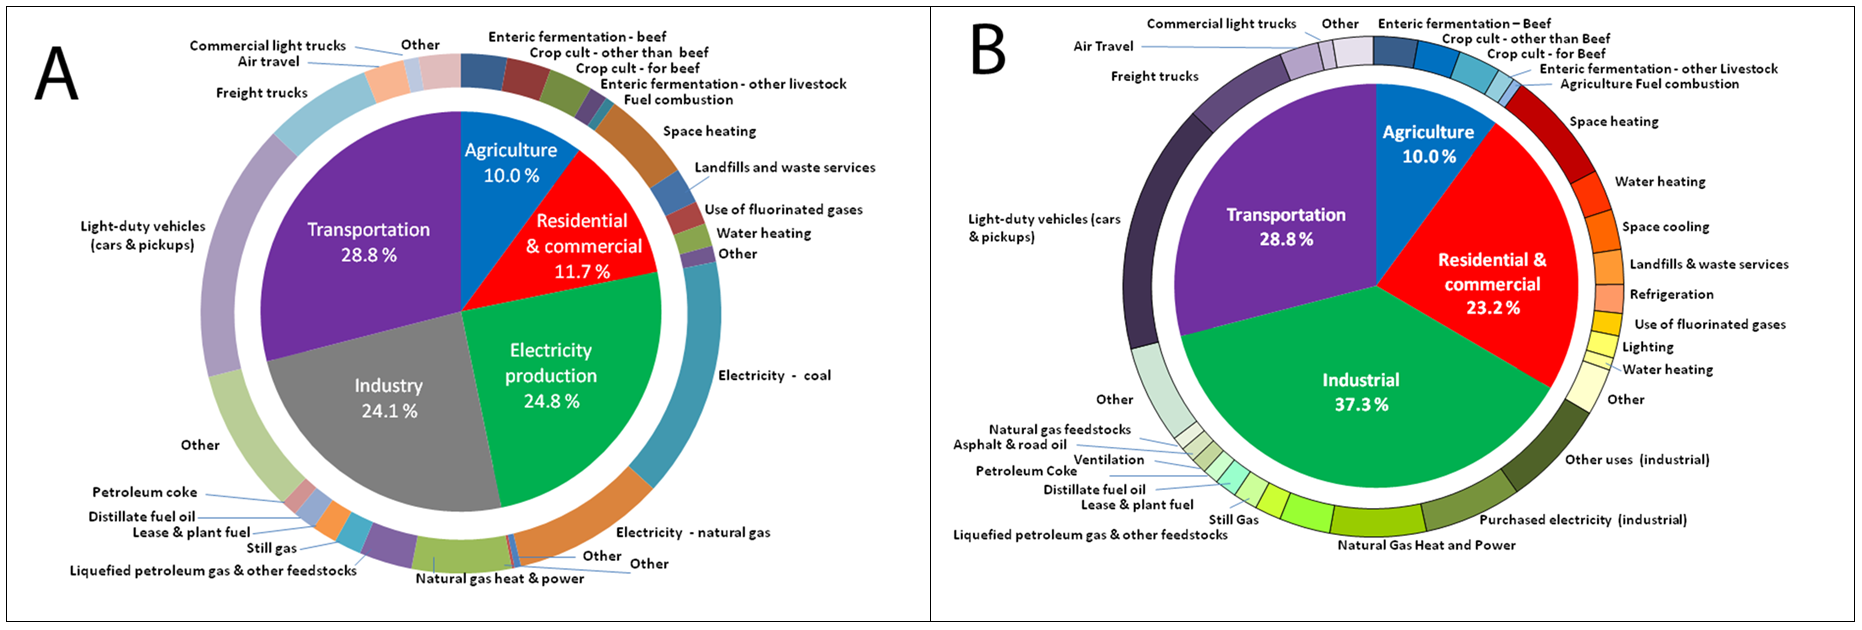 There are about 60 major sources of greenhouse gas emissions in the U.S. (source: Energy Information Agency-EIA). These sources are generally grouped into five economic sectors based on where the emissions were generated (Figure A): Residential and Commercial, Agriculture, Transportation, Industry, and Electricity Production. In this grouping, production of electricity is considered as a separate sector, and emissions generated at power plants are accounted for in the Electricity Production sector. In 2018 the relative percentages for the fives sectors were 29% for transportation, 25% for electricity production, 24% for industrial uses, 12% for buildings, and 10% for agricultural activities. In the electricity sector over the last 10 years, coal use has declined by about 35% while natural gas usage has increased about 60%. These sources can also be grouped into four economic sectors based on where the energy was consumed (Figure B): Residential and Commercial, Agriculture, Transportation, Industry. In this grouping, the emissions attributable to Electricity Production are distributed among the four economic sectors. Emissions from a given activity within a sector include emissions from production of electricity that is consumed in that activity, as well emissions generated by use of fossil fuels for that activity. In 2018 the relative percentages for the fives sectors were 37% for Industrial consumption 29% for Transportation, 23% for Residential and Commercial consumption, and 10% for Agriculture. | | | |
2019 US Greenhouse Gas Emissions by End Use Production (Where the fossil fuel is burned)
2019 Greenhouse Gas Emissions by End Use Energy Consumption
U.S. greenhouse gas emissions are grouped according to where they were produced (or burned - Figure A) and according to where they were consumed (or used – Figure B).There are about 60 major sources of greenhouse gas emissions in the U.S. (source: Energy Information Agency-EIA). These sources are generally grouped into five economic sectors based on where the emissions were generated (Figure A): Residential and Commercial, Agriculture, Transportation, Industry, and Electricity Production. In this grouping, production of electricity is considered as a separate sector, and emissions generated at power plants are accounted for in the Electricity Production sector. In 2018 the relative percentages for the fives sectors were 29% for transportation, 25% for electricity production, 24% for industrial uses, 12% for buildings, and 10% for agricultural activities. In the electricity sector over the last 10 years, coal use has declined by about 35% while natural gas usage has increased about 60%. These sources can also be grouped into four economic sectors based on where the energy was consumed (Figure B): Residential and Commercial, Agriculture, Transportation, Industry. In this grouping, the emissions attributable to Electricity Production are distributed among the four economic sectors. Emissions from a given activity within a sector include emissions from production of electricity that is consumed in that activity, as well emissions generated by use of fossil fuels for that activity. In 2018 the relative percentages for the fives sectors were 37% for Industrial consumption 29% for Transportation, 23% for Residential and Commercial consumption, and 10% for Agriculture.
| 2018 U.S. Greenhouse Gas Emissions – A: Direct Emissions by Sector B: Emissions By End Use Sector | | U.S. greenhouse gas emissions are grouped according to where they were produced (or burned - Figure A) and according to where they were consumed (or used – Figure B). |
There are about 60 major sources of greenhouse gas emissions in the U.S. (source: Energy Information Agency-EIA). These sources are generally grouped into five economic sectors based on where the emissions were generated (Figure A): Residential and Commercial, Agriculture, Transportation, Industry, and Electricity Production. In this grouping, production of electricity is considered as a separate sector, and emissions generated at power plants are accounted for in the Electricity Production sector. In 2018 the relative percentages for the fives sectors were 29% for transportation, 25% for electricity production, 24% for industrial uses, 12% for buildings, and 10% for agricultural activities. In the electricity sector over the last 10 years, coal use has declined by about 35% while natural gas usage has increased about 60%. These sources can also be grouped into four economic sectors based on where the energy was consumed (Figure B): Residential and Commercial, Agriculture, Transportation, Industry. In this grouping, the emissions attributable to Electricity Production are distributed among the four economic sectors. Emissions from a given activity within a sector include emissions from production of electricity that is consumed in that activity, as well emissions generated by use of fossil fuels for that activity. In 2018 the relative percentages for the fives sectors were 37% for Industrial consumption 29% for Transportation, 23% for Residential and Commercial consumption, and 10% for Agriculture. | | | URL: https://www.eia.gov/environment/emissions/ghg_report/ghg_overview.php |
|
|